
martedì 8 agosto 2017

venerdì 4 agosto 2017

giovedì 3 agosto 2017

mercoledì 2 agosto 2017

It Won't Be Long Now - David Stockman Warns Amazon Is The New Tech Crash
It won’t be long now. During the last 31 months the stock market mania has rapidly narrowed to just a handful of shooting stars.
At the forefront has been Amazon.com, Inc., which saw its stock price double from $285 per share in January 2015 to $575 by October of that year. It then doubled again to about $1,000 in the 21 months since.
By contrast, much of the stock market has remained in flat-earth land. For instance, those sections of the stock market that are tethered to the floundering real world economy have posted flat-lining earnings, or even sharp declines, as in the case of oil and gas.
Needless to say, the drastic market narrowing of the last 30 months has been accompanied by soaring price/earnings (PE) multiples among the handful of big winners. In the case of the so-called FAANGs + M (Facebook, Apple, Amazon, Netflix, Google and Microsoft), the group’s weighted average PE multiple has increased by some 50%.
The degree to which the casino’s speculative mania has been concentrated in the FAANGs + M can also be seen by contrasting them with the other 494 stocks in the S&P 500. The market cap of the index as a whole rose from $17.7 trillion in January 2015 to some $21.2 trillion at present, meaning that the FAANGs + M account for about 40% of the entire gain.
Stated differently, the market cap of the other 494 stocks rose from $16.0 trillion to $18.1 trillion during that 30-month period. That is, 13% versus the 82% gain of the six super-momentum stocks.
Moreover, if this concentrated $1.4 trillion gain in a handful of stocks sounds familiar that’s because this rodeo has been held before. The Four Horseman of Tech (Microsoft, Dell, Cisco and Intel) at the turn of the century saw their market cap soar from $850 billion to $1.65 trillion or by 94% during the manic months before the dotcom peak.
At the March 2000 peak, Microsoft’s PE multiple was 60X, Intel’s was 50X and Cisco’s hit 200X. Those nosebleed valuations were really not much different than Facebook today at 40X, Amazon at 190X and Netflix at 217X.
The truth is, even great companies do not escape drastic over-valuation during the blow-off stage of bubble peaks. Accordingly, two years later the Four Horseman as a group had shed $1.25 trillion or 75% of their valuation.
More importantly, this spectacular collapse was not due to a meltdown of their sales and profits. Like the FAANGs +M today, the Four Horseman were quasi-mature, big cap companies that never really stopped growing.
Now I’m targeting the very highest-flyer of the present bubble cycle, Amazon.
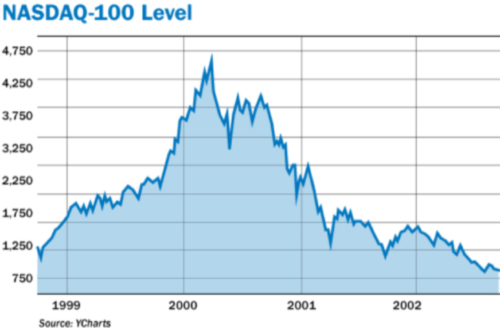
Just as the NASDAQ 100 doubled between October 1998 and October 1999, and then doubled again by March 2000, AMZN is in the midst of a similar speculative blow-off.
Not to be forgotten, however, is that one year after the March 2000 peak the NASDAQ 100 was down by 70%, and it ultimately bottomed 82% lower in September 2002. I expect no less of a spectacular collapse in the case of this cycle’s equivalent shooting star.
In fact, even as its stock price has tripled during the last 30 months, AMZN has experienced two sharp drawdowns of 28% and 12%, respectively. Both times it plunged to its 200-day moving average in a matter of a few weeks.
A similar drawdown to its 200-day moving average today would result in a double-digit sell-off. But when — not if — the broad market plunges into a long overdue correction the ultimate drop will exceed that by many orders of magnitude.
Amazon’s stock has now erupted to $1,000per share, meaning that its market cap is lodged in the financial thermosphere (highest earth atmosphere layer). Its implied PE multiple of 190X can only be described as blatantly absurd.
After all, Amazon is 24 years-old, not a start-up. It hasn’t invented anything explosively new like the iPhone or personal computer. Instead, 91% of its sales involve sourcing, moving, storing and delivering goods. That’s a sector of the economy that has grown by just 2.2% annually in nominal dollars for the last decade, and for which there is no macroeconomic basis for an acceleration.
Yes, AMZN is taking share by leaps and bounds. But that’s inherently a one-time gain that can’t be capitalized in perpetuity at 190X. And it’s a source of “growth” that is generating its own pushback as the stronger elements of the brick and mortar world belatedly pile on the e-commerce bandwagon.
Wal-Mart’s e-commerce sales, for example, have exploded after its purchase of Jet.com last year — with sales rising by 63% in the most recent quarter.
Moreover, Wal-Mart has finally figured out the free shipments game and has upped its e-commerce offering from 10 million to 50 million items just in the past year.
Wal-Mart is also tapping for e-commerce fulfillment duty in its vast logistics system — including its 147 distribution centers, a fleet of 6,200 trucks and a global sourcing system which is second to none.
In this context, even AMZN’s year-over-year sales growth of 22.6% in Q1 2017 doesn’t remotely validate the company’s bubblicious valuation — especially not when AMZN’s already razor thin profit margins are weakening, not expanding.
Based on these basic realities, Jeff Bezos will never make up with volume what he is losing in margin on each and every shipment.
The Amazon business model is fatally flawed. It’s only a matter of the precise catalyst that will trigger the realization in the casino that this is another case of the proverbial naked emperor.
Needless to say, I do not think AMZN is a freakish outlier. It’s actually the lens through which the entire stock market should be viewed because the whole enchilada is now in the grips of a pure mania.
Stated differently, the stock market is no longer a discounting mechanism nor even a weighing machine. It’s become a pure gambling hall.
So Bezos’ e-commerce business strategy is that of a madman — one made mad by the fantastically false price signals emanating from a casino that has become utterly unhinged owing to 30 years of Bubble Finance policies at the Fed and its fellow central banks around the planet.
Indeed, the chart below leaves nothing to the imagination. Since 2012, Amazon stock price has bounded upward in nearly exact lock-step with the massive balance sheet expansion of the world’s three major central banks.
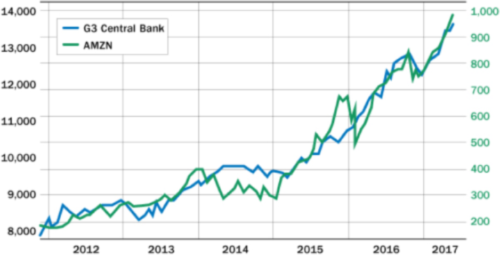
At the end of the day, the egregiously overvalued Amazon is the prime bubble stock of the current cycle. What the Fed has actually unleashed is not the healthy process of creative destruction that Amazon’s fanboys imagine.
Instead, it embodies a rogue business model and reckless sales growth machine that is just one more example of destructive financial engineering, and still another proof that monetary central planning fuels economic decay, not prosperity.
Amazon’s stock is also the ultimate case of an utterly unsustainable bubble. When the selling starts and the vast horde of momentum traders who have inflated it relentlessly in recent months make a bee line for the exits, the March 2000 dotcom crash will seem like a walk in the park.
martedì 1 agosto 2017

Why Bitcoin Is Not 'Digital' Gold Or Silver
By Keith WeinerMarket Overview6 hours ago (Aug 01, 2017 12:16AM ET)
Precious Metals Supply and Demand Report
That’s it. It’s the final straw. One of the alternative investing newsletters had a headline that screamed, “Bitcoin Is About to Soar, But You Must Act by August 1 to Get In”. It was missing only the call to action “call 1-800-BIT-COIN now! That number again is 800 B.I.T..C.O.I.N.”
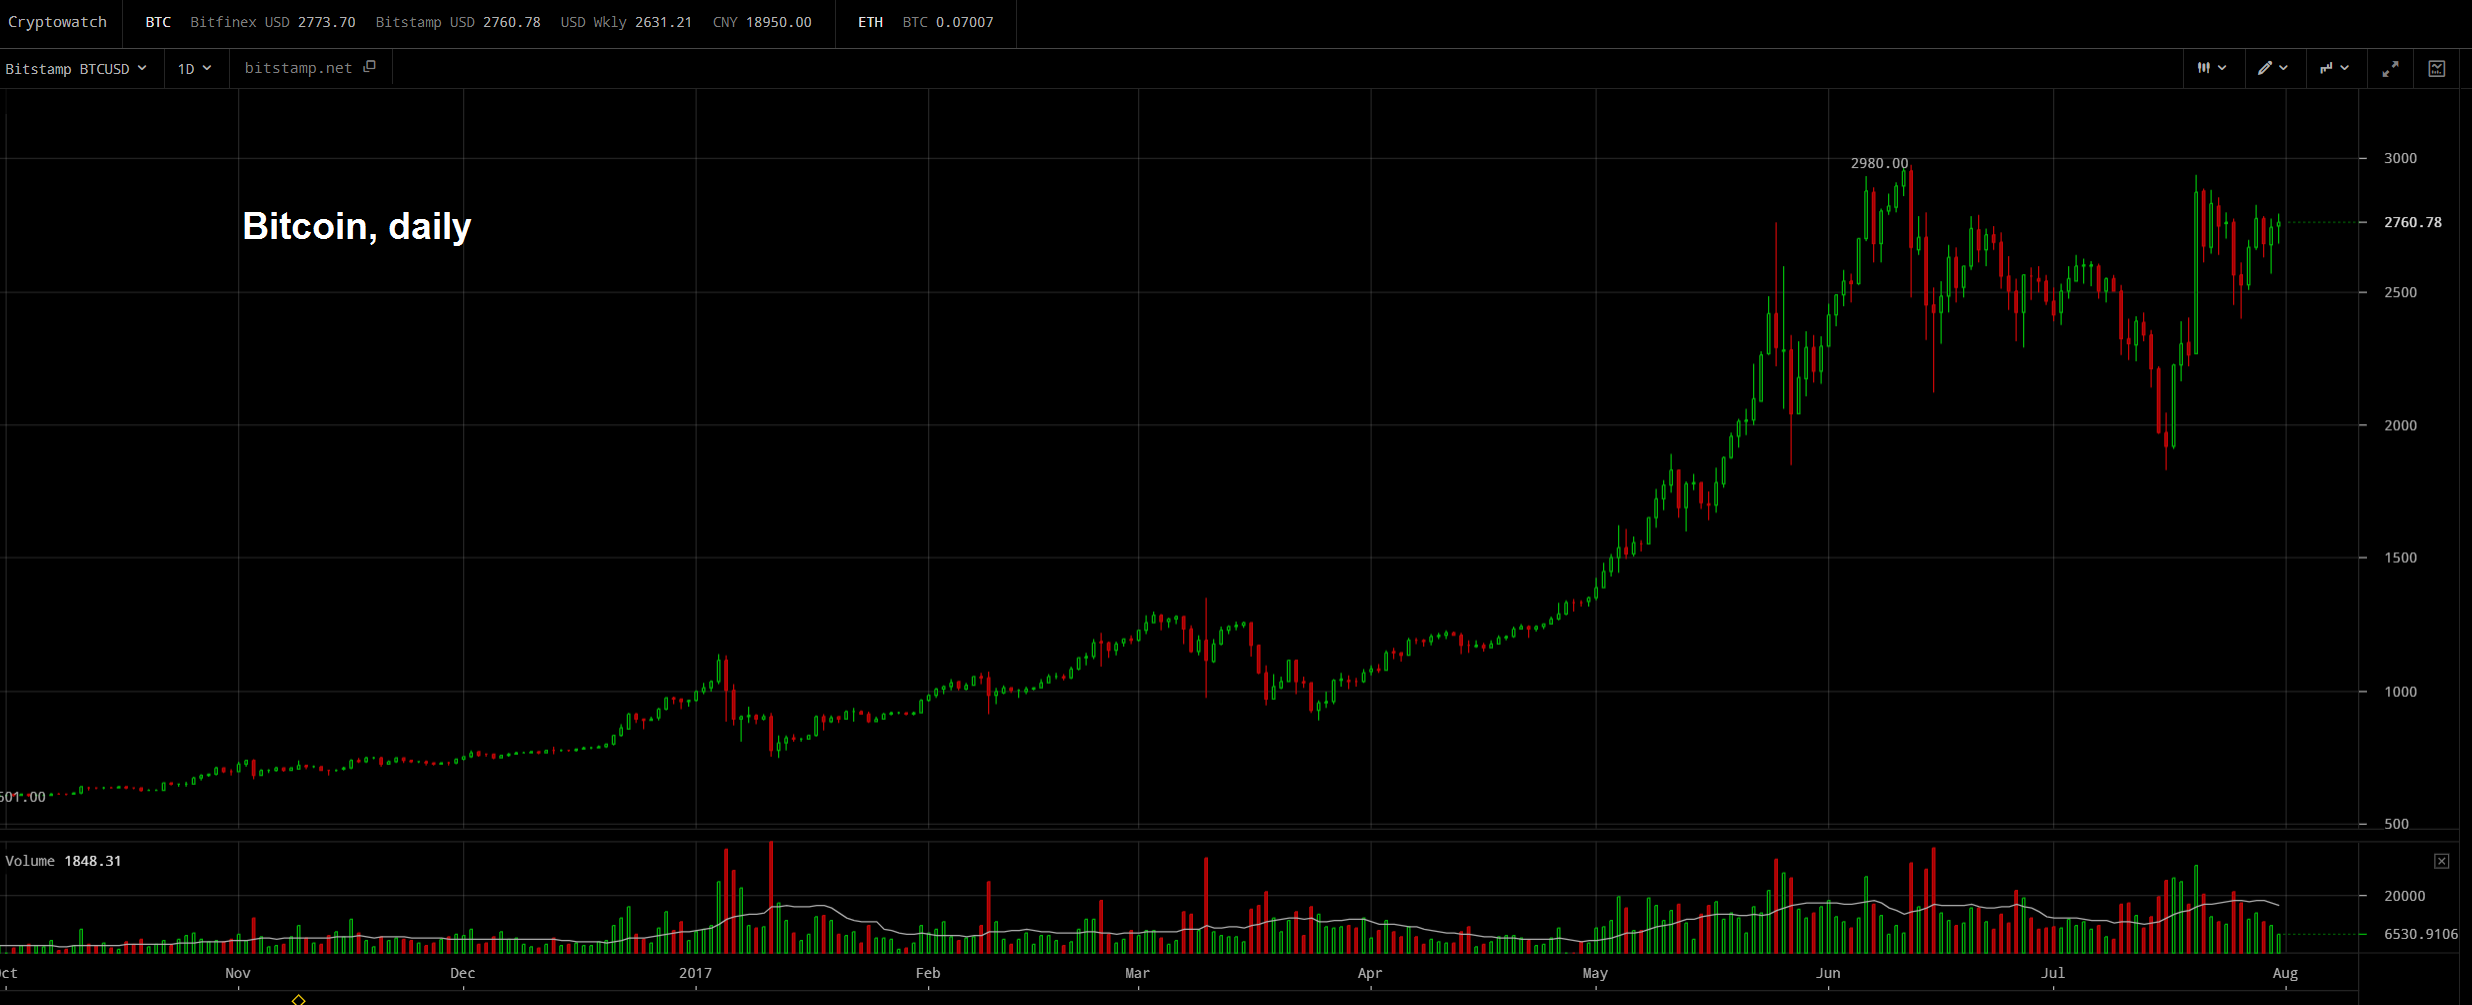
Bitcoin, daily. In terms of the gains recorded between the lows of 2009 and the recent highs (from less eight hundredths of a US cent per bitcoin, or $1 = 1,309.2 BTC, the first officially recorded value of BTC, to $3,000 per bitcoin, or $1 = 0.000333333 BTC), the bubble in bitcoin by now exceeds every historical precedent by several orders of magnitude, including the infamous Tulipomania and Kuwait’s Souk-al-Manakh bubble.
In percentage terms BTC has increased by about 392,760,000% in dollar terms (more than 392 million percent) since its launch eight years ago. Comparable price increases have otherwise only occurred in hyperinflation scenarios in which the underlying currency was repudiated as a viable medium of exchange. Our view regarding its prior non-monetary use value and hence its potential to become money differs slightly from that presented by Keith below. We will post more details on this soon, for now we only want to point out that we believe there is room for further debate on this point. [note from Pater Tenebrarum] .
Is it about to go up? Maybe. We don’t know. And everyone should by now be skeptical of all “rocket to take off on XYZ date” claims. Between them, surely these newsletters have predicted thousands of the past zero blastoffs of gold and silver since 2011.
We have discussed bitcoin in the past, to argue that it is not money (a video here, and articles here and here). Bitcoin is not money because it is not a good. It’s just a number in a database. Money is a kind of good (genus). The most marketable kind (differentia).
Money must be a good because we are physical beings in a physical world and final payment — which is not demanded all the time, or even often — must be a physical thing that you can hold and touch in your physical hands. Bitcoin is not a physical good, so it represents, not final payment, but intermediate payment. It is not final until you trade the bitcoin for a real good. In the language of economics, a real good has utility apart from one’s hope to exchange it for something else. Bitcoin has no utility apart from this hope of its value in exchange, its price.
There is not one price but always two prices: bid and offer. When one has a thing and relies on someone else to buy it (or accept it in exchange), it is the bid price which is relevant. The offer price may be close above the bid, or it may be much higher. Typically sellers are reluctant to sell below their cost, but that has nothing to do with buyers. Buyers make a bid based on how they value it (or not).
This fact right here is sufficient to debunk the labor theory of value. Suppose producing a painting takes you 50 hours of labor plus $100 in materials. That does not matter. If your name is Banksy, people might be happy to pay tens of thousands of dollars for the painting. If your name is Keith Weiner, not so much (Keith is not known for having any skill at painting, though he can take some mean photographs).
For all commodities, for all real goods, for all tangible products, there is always a bid. Even a junk car is worth something to the scrap dealer. Even sand is worth something to the landscape contractor.
If a commodity is useful for something, it will have a robust bid. The price may be low or high, but the bid will be set by those who have a productive purpose in mind. If you can buy something, add a little bit of value from labor (e.g. cleaning it up) and sell it for $1,000 then you are willing to pay up to, say, $900.
Take copper. Copper can be used for wiring and plumbing (and many other things). If you manufacture plumbing, and you know that with a dollar worth of labor you can turn copper into a pipe that sells for $3.75, what are you willing to pay for the copper? Perhaps you would go up to $2.50 (it’s now about $2.85). If the price of copper drops, this new buyer will come into the market (for now, plumbing is made of plastic).
In this light, we now get to the 64 billion dollar question. What is the bid on bitcoin? What is it useful for, and who would buy it for that purpose?
Right now, bitcoin is a lot of fun. Its price is being driven up by frenzied speculators. With each new price level, proponents become bolder and more aggressive. Bitcoin will replace the dollar, bitcoin will go up to $1,000,000, the dollar is failing, get yours before August 1, etc. Many of these arguments were popular when the price of gold was rising relentlessly up through 2011.
But what is the ultimate bid? Where is the floor, where it cannot go below, because it is just too profitable to buy it, transform it into a higher-value good to sell at a profit? Where is the floor where individuals will buy more and more because they want bitcoin in their living room, or in the tank of the car, or in their refrigerator, or in their basement? It doesn’t exist, does it?
This is not a prediction for tomorrow morning. Indeed timing these things is impossible. However, there will come a point when the speculators turn. Perhaps their collective thumbs will move the planchette on the price-chart Ouija board to paint an ugly chart pattern (much uglier than head-and-shoulders). Whatever its initial cause, what will happen is clear in light of the above discussion.
The price of bitcoin could drop to any level. Incidentally, bitcoin could be used in exchange as it is now, whether its price is $0.01 or $1,000,000.
People often say that bitcoin is like gold, or even say it is “digital gold”. They are just trying to cash in on gold’s good name. The problem of the bid is another key difference between bitcoin and gold. Gold is an extremely useful commodity. Bitcoin is not any kind of commodity at all. It does not have a real bid at all, only the ever-changing bid of the fickle speculator.
Fundamental Developments
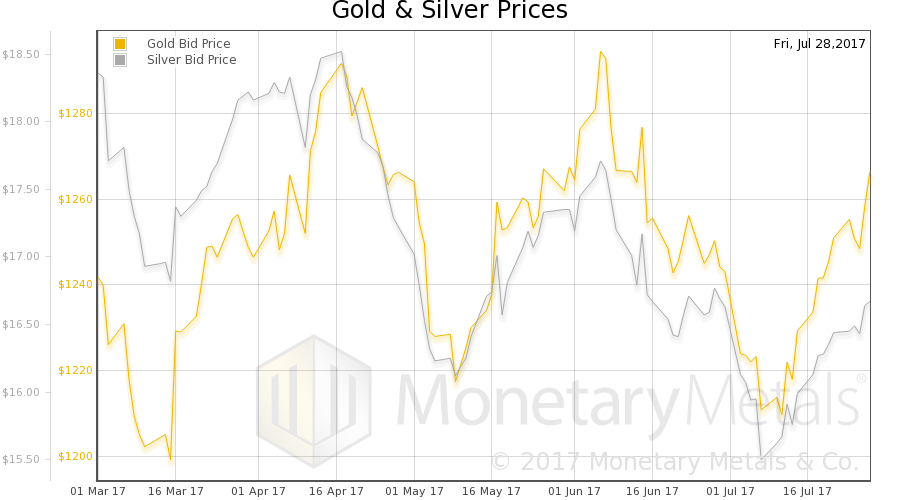
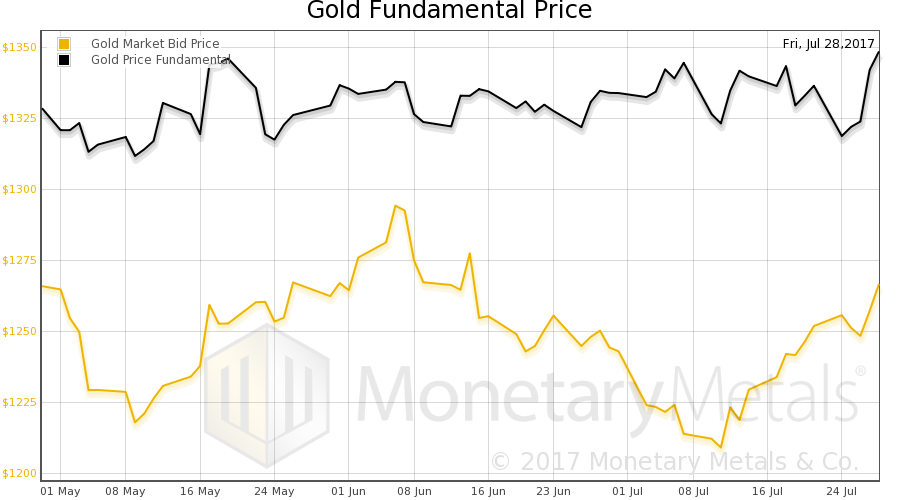
The prices of the metals rose some more last week, with gold +$13 and silver +$0.24. However, that leads to the question: is it speculators getting ahead of the fundamentals, or is it real?
Three weeks ago, with the price of gold $56 lower and the price of silver $1.15 lower than today, we asked if that was capitulation. We cited some circumstantial evidence (plus rising scarcity of both metals as measured by the co-basis). We did not call for a moonshot, but a “normal trading bounce within the range.”
Today it is time to ask if the bounce is down, and if now is the time for a normal correction. And if it the answer is the same for both metals. We will show graphs of the true measure of the fundamentals. But first charts of their prices and the gold-silver ratio.
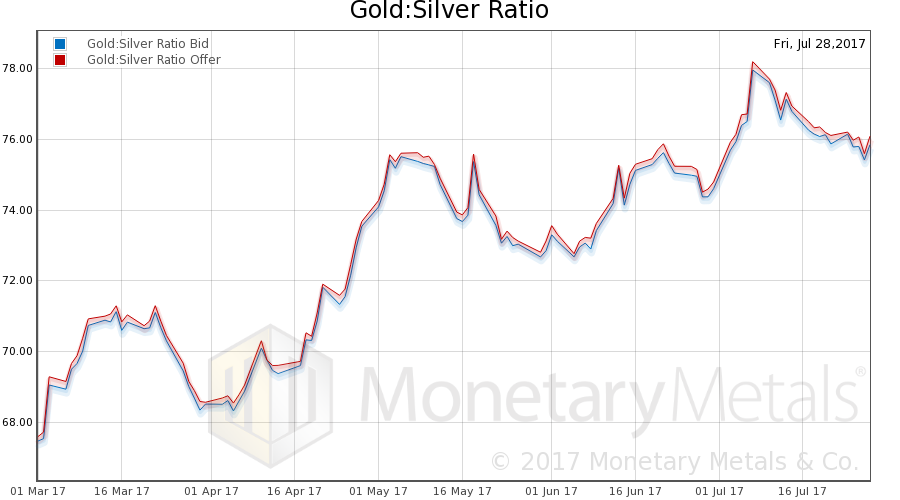
Next, this is a graph of the gold price measured in silver, otherwise known as the gold-to-silver ratio. The ratio moved down slightly this week. We find it interesting that the ratio did not fall farther.
In this graph, we show both bid and offer prices for the gold-silver ratio. If you were to sell gold on the bid and buy silver at the ask, that is the lower bid price. Conversely, if you sold silver on the bid and bought gold at the offer, that is the higher offer price.
For each metal, we will look at a graph of the basis and co-basis overlaid with the price of the dollar in terms of the respective metal. It will make it easier to provide brief commentary. The dollar will be represented in green, the basis in blue and co-basis in red.
Here is the gold graph.
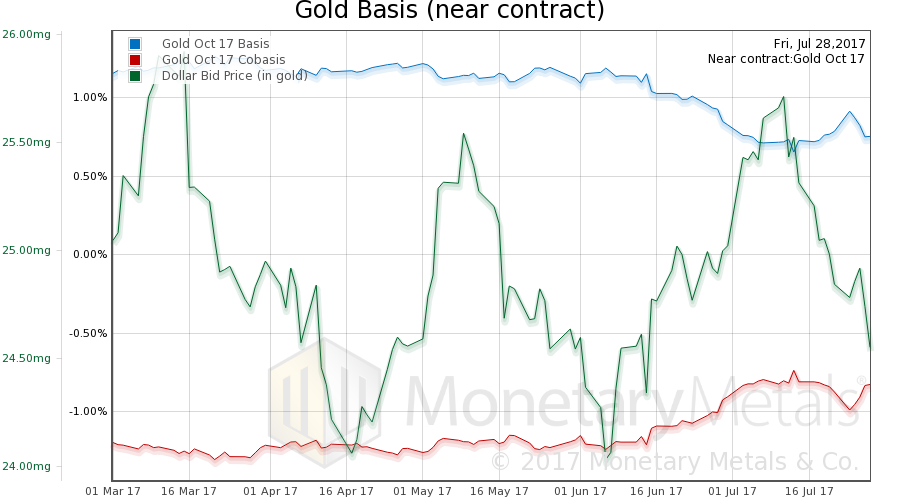
October gold basis and co-basis and the dollar priced in milligrams of gold
The dollar fell again this week (the mirror image of the rising price of gold). As the dollar fell, the co-basis increased — gold became more scarce.
Rising price + rising scarcity = rising fundamental price.
Now let’s look at silver.
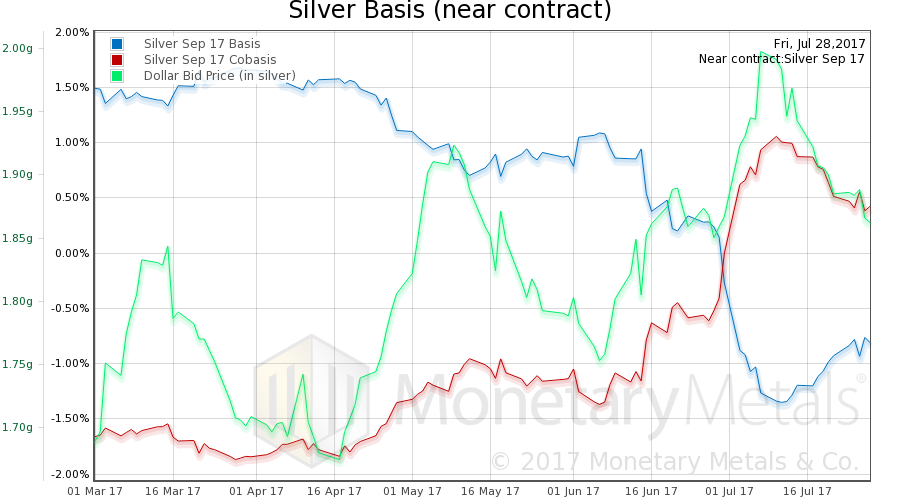
In silver, unlike in gold, as the dollar has dropped (i.e., the price of silver measured in dollars has risen), the metal has become more abundant.
Our calculated silver fundamental price fell about 50 cents this week, or about 75 cents in the past few weeks. So while the price of gold may continue to rise to perhaps over $1,300, the price of silver could be a bit weaker. We calculate a fundamental gold-silver ratio of about 79.
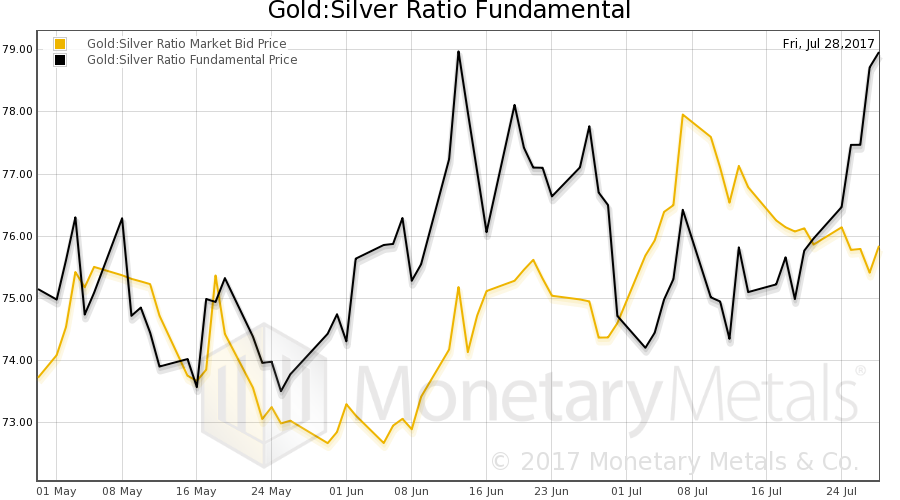
Fundamental gold-silver ratio vs. market ratio based on bid prices
Coming back to the bid-ask spread, we thought we would publish another chart off our website. This one shows the bid-ask spread of spot gold and spot silver.
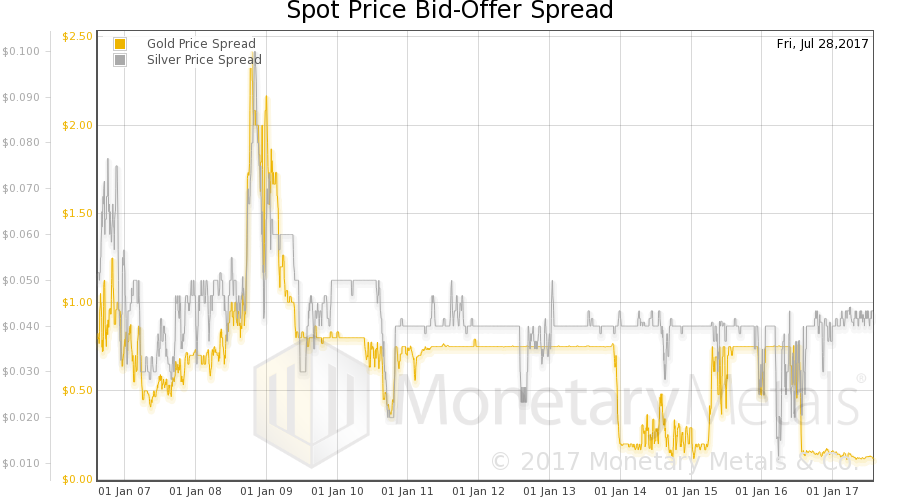
Bid/ask spreads of gold and silver
There are two salient features. First, note that the spread is really tight in both metals (though while the spread in gold dropped in mid-2016, in silver it increased). It is currently around 12 cents in gold. An ounce of gold is over $1,200 and the difference between bid and ask is $0.12 or 0.01 percent! In silver, it is around 4.2 cents, or 0.25 percent. Gold is more liquid, much more liquid.
Second, when the financial system buckled and nearly collapsed in 2008, the spreads widened to $2.40 and $0.10 in gold and silver, or 0.33 percent and 1.05% respectively. Compared to real estate in a normal market, both metals are extremely tight. Compared to illiquid assets during the peak of the crisis, it’s incredible.
We recall a story of a guy who bought a famous painting by an Old Master near the top in 2007. He paid, as we now recall, around $13 million. During the crisis, he was forced to sell it. He got $100,000. We assume the offer price on such a painting would still be $10 million or more. But $100,000 was the bid.
Iscriviti a:
Post (Atom)